The CT head scan is one of the most common imaging studies that you can be faced with and the most frequently requested by A&E. This article will cover some of the underlying principles of CT head studies, and discuss a method for their interpretation.

Head CT Interpretation

Computed tomography (CT) scanning involves the use of X-rays to take cross-sectional images of the body. This is possible as different tissues interact with X-rays in different ways. Some tissues will allow the passage of X-rays without influencing them much, whilst other tissues will exert a more significant effect. The extent to which a material can be penetrated by an X-ray beam is described in terms of an attenuation coefficient which assesses how much a beam is weakened by passing through a voxel of tissue (voxel = volumetric pixel).
These values are frequently expressed as Hounsfield units (HU). Distilled water at standard temperature and pressure has 0 HU, whereas air under the same conditions has -1000 HU. Approximate values for various tissues are outlined in table 1 (these are not set in stone – only rough estimates).
Table
| Tissue | HU |
| Air | -1000 |
| Water | 0 |
| Cerebrospinal fluid | +15 |
| White matter | +20 to +30 |
| Grey matter | +37 to +45 |
| Coagulated blood | +50 to +75 |
| Bone | +200 to +3000 |
Windowing
This gives rise to a dilemma. An article published in 2007 concluded that although a human observer could distinguish between up to 900 shades of grey, most scan viewing platforms show images in 256 shades . If we are trying to visualise a range of units from -1000 to +3000 in terms of 256 shades of grey, for every incremental change in the greyscale there will be a difference of approximately 15 HU. In short, there will not be enough contrast to reliably discern between structures. This problem is negotiated with windowing.
Windowing (also known as grey-level mapping) is the process of changing the location and width of the available greyscale in order to optimise discrimination between tissues. This is best explained visually.
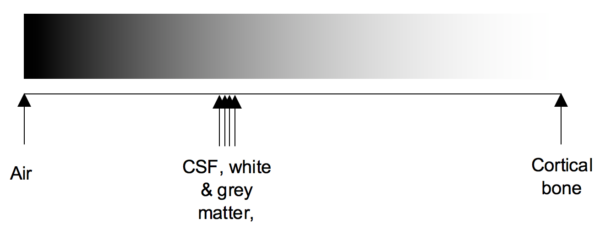
Below we can see a greyscale (from white to black) being assigned to the whole range of HU (from air to cortical bone). We can imagine that this may not provide sufficient contrast to differentiate between grey and white matter, and coagulated blood.
Changing the width of the greyscale
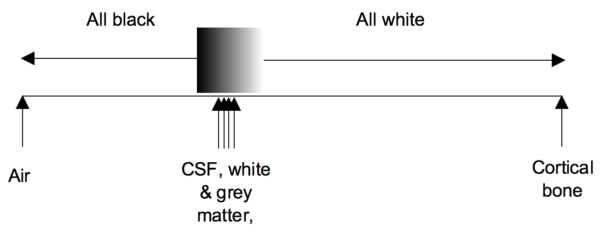
Here we have changed the width (w value) of the greyscale – we are now visualising 200 HU in 256 shades. This gives us a much better contrast between CSF, brain matter and blood. However, everything above blood will appear as white and everything below CSF will appear as black.
Changing the centre of the greyscale
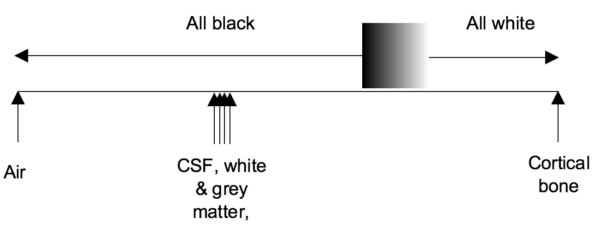
Now we have changed the centre (c or l value) of the greyscale – we are getting the same contrast but at a different range of Hounsfield units. This process of changing the centre and width of the greyscale is windowing.
This business of windowing may seem unnecessary to discuss. However, almost everyone will find themselves fiddling with the windowing on a scan at some point. Hopefully, some understanding of what this is actually doing will help you achieve the best contrast in an image.
Confirm details
As with the interpretation of all studies, the first step is to confirm you have the correct patient and scan.
Check the following details:
- Patient name, hospital number and date of birth
- Date and time the scan was acquired
- Previous scans (if available) for comparison
The appearance of tissues on a CT scan is described in terms of ‘density’. Darker structures are ‘hypodense or low density’; brighter structures are ‘hyperdense or high density’.
Blood Can Be Very Bad is a mnemonic that can be used when faced with interpreting a CT head scan:
- Blood
- Cisterns
- Brain
- Ventricles
- Bone
Think of this approach as a framework for a quick review of a scan – it won’t turn you into an experienced radiologist! It’s important to recognise that more subtle signs might still be overlooked. Furthermore, you should work through the entire system even if you spot something obvious early on (e.g. if you see a large extradural haematoma, still check the cisterns, brain, ventricles and bone for any other abnormalities).
Blood
Inspect for evidence of bleeding which may include:
- Extradural haematoma (extra-axial)
- Subdural haematoma (extra-axial)
- Subarachnoid haemorrhage (SAH): may be very subtle. Remember a SAH can extend into the ventricular system so always look at the posterior horns as blood may collect in the dependant portion.
- Intracerebral haemorrhage (intra-axial): this may be intraventricular (within the ventricles) and/or intraparenchymal (within the brain tissue).
Bear in mind that blood will have varying appearances depending on the age of the collection, with a more acute haematoma appearing hyperdense compared to a chronic bleed. Some bleeds may also be very subtle and difficult to spot unless you look closely and this is one of the reasons why windowing is so important.
Extradural haematoma
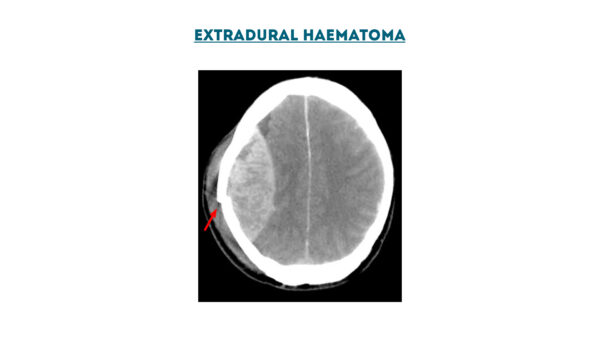
An extradural haematoma is a collection of blood which forms between the dura mater and skull (they can also occur in the spine although this is much rarer). Extradural haemorrhage is often preceded by a clear history of trauma, therefore you should look carefully for evidence of an associated fracture.
The majority of cases of extradural haematoma result from trauma to the middle meningeal artery. Extradural haematomas need to be identified and managed without delay, as they cannot cross skull sutures and hence expand inwards towards the brain tissue. As a result, intracranial pressure can rise rapidly and without prompt evacuation of the haematoma, brainstem herniation can occur.
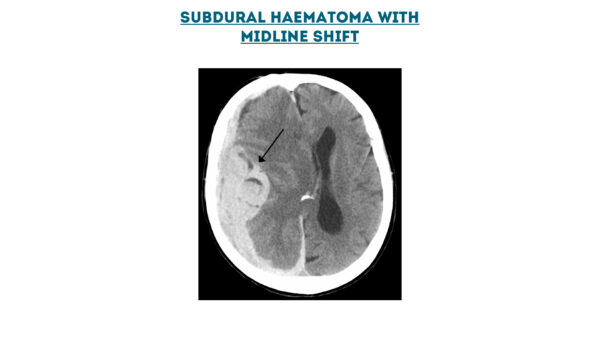
Subdural haematoma
A subdural haematoma forms between the dura and the arachnoid mater and typically develops secondary to trauma (as a result of tearing of bridging veins). In elderly patients who have experienced a fall, the inciting traumatic event may be less obvious.
Subarachnoid haemorrhage
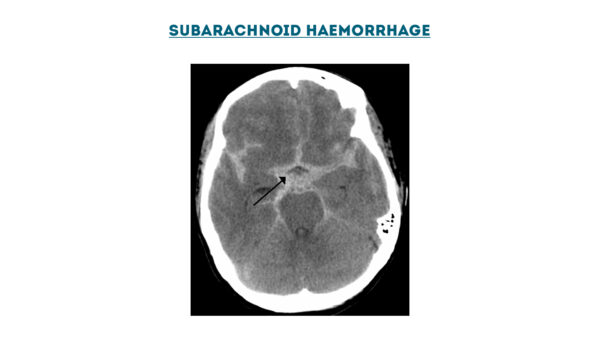
A subarachnoid haemorrhage involves bleeding into the subarachnoid space (between the arachnoid and pia mater). This space normally contains CSF and the vasculature of the brain. The most common cause of subarachnoid haemorrhage is trauma, however, they can also develop spontaneously (e.g. aneurysmal rupture).
Intracerebral haemorrhage
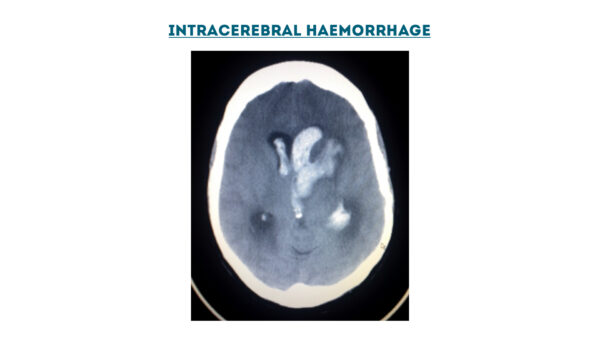
Intracerebral haemorrhage involves bleeding within the brain secondary to a ruptured blood vessel. Intracerebral haemorrhages can be intraparenchymal (within the brain tissue) and/or intraventricular (within the ventricles).
Cisterns
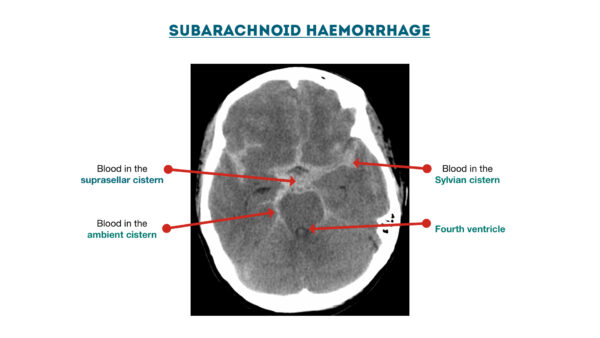
There are four key cisterns that which should be assessed for effacement, the presence of blood and asymmetry:
- Ambient cistern: surrounding the midbrain.
- Suprasellar cistern: superior to the sella turcica.
- Quadrigeminal cistern: adjacent to the corpora quadrigemina.
- Sylvian cistern: across the insular surface and within the Sylvian fissure.
Brain
Sulcal effacement
Sulcal effacement is the term used to describe the loss of the normal gyral-sulcal pattern of the brain, which is typically associated with raised intracranial pressure.
Grey-white matter differentiation
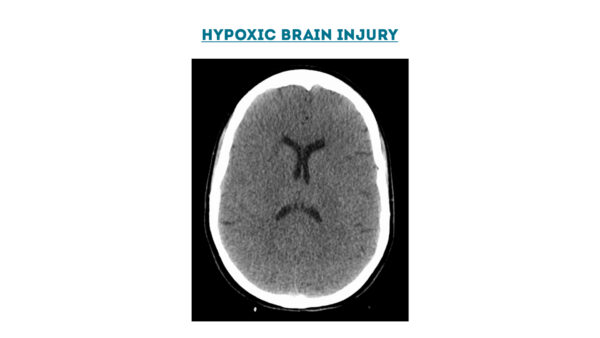
On a normal CT head scan, the grey and white matter should be clearly differentiated. Loss of this differentiation suggests the presence of oedema which may develop secondary to a hypoxic brain injury, infarction (e.g. ischaemic stroke), tumour or cerebral abscess.
Abnormal shifts of brain tissue
Look for abnormal shifts of brain tissue and/or herniation:
- Subfalcine: beneath the falx cerebri
- Uncal: inferomedial displacement of the uncus
- Transcalvarial: brain shift through the calvarium
- Transtentorial: may be superior or inferior
- Tonsillar: downward displacement of the cerebellar tonsils into the foramen magnum
Hypo/hyperdense foci
Hypodense foci
Hypodensity on a CT head may be due to the presence of air, oedema or fat:
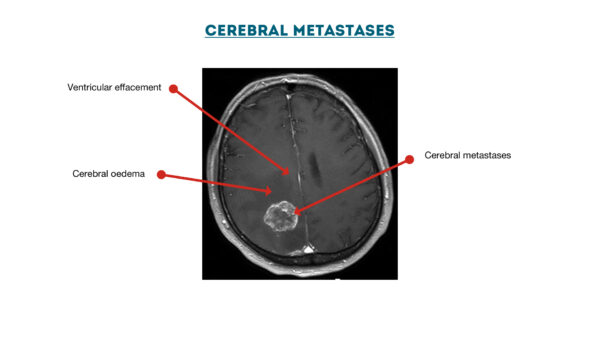
- Oedema is often seen surrounding intracerebral bleeds, tumours and abscesses.
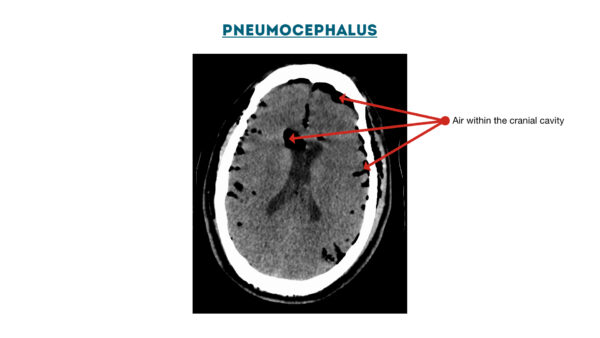
- Pneumocephalus (air within the cranial vault) may be noted after neurosurgery or adjacent to the inner table in cases of calvarial fractures.
Hyperdense foci
Hyperdensity on a CT head may be due to the presence of blood, thrombus or calcification:
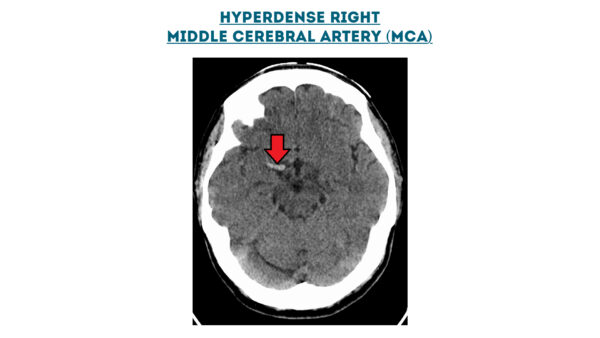
- A hyperdense middle cerebral artery (MCA) is sometimes noted in total anterior circulation strokes (TACS) and indicates the presence of a large thrombus within the vessel.
Tumour
Radiological features
The radiological features of a tumour will vary depending on the histological diagnosis.
Any of the following may be noted in our around a tumour:
- Surrounding haemorrhage: may be hyperdense, isodense or hypodense depending on the maturity of the bleed.
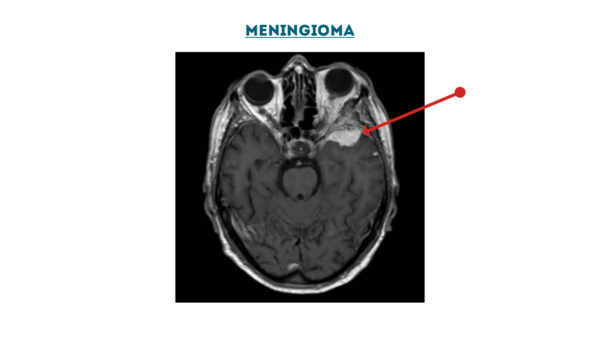
- Calcification: hyperdense on CT and typically associated with meningiomas.
- Mass effect: displacement of tissue due to the tumour or associated bleeding/oedema.
- Oedema (hypodense): may be present in the brain tissue surrounding the tumour.
Contrast administration
Following intravenous administration of a contrast medium, lesions may show no change, or demonstrate some form of contrast enhancement (e.g. homogenous enhancement, ring-enhancement etc):
- Homogenous enhancement occurs in a number of lesions including meningiomas and highly vascular tumours.
- Ring-enhancement is typically associated with cerebral abscesses and some types of cerebral metastases (e.g. melanoma).
Ventricles
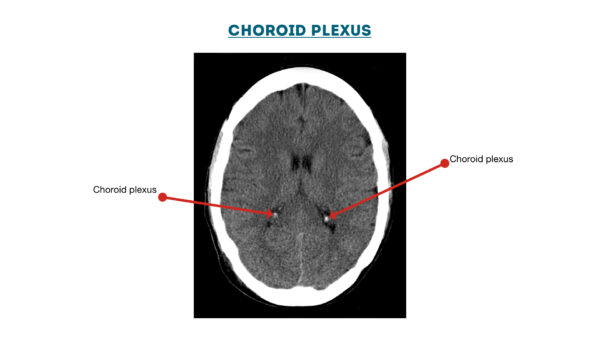
Intraventricular haemorrhage and the choroid plexus
Intraventricular haemorrhage appears on a CT head as hyperdensity within the ventricular system.
However, not all hyperdensity in the ventricles represents acute bleeding: the choroid plexus is frequently calcified and often appears bright on CT. Remember that blood is fluid and hence will be dependent within the ventricles, therefore if you note a high-density signal within the lateral walls of the ventricles it is likely to represent the choroid plexus.
Hydrocephalus
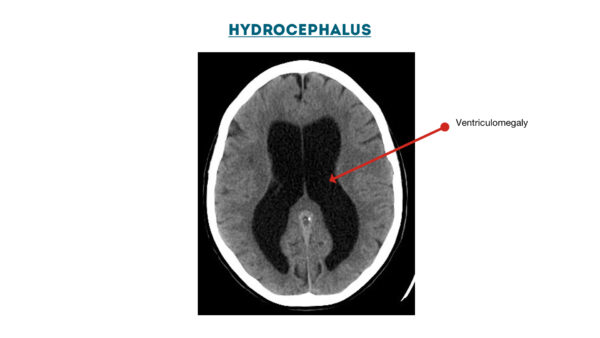
Hydrocephalus is a term that describes the abnormal accumulation of CSF in the ventricles of the brain. It can be broadly divided into communicating (i.e. non-obstructive) and non-communicating (i.e. obstructive). An early sign of hydrocephalus on a CT head is dilation of the temporal horns.
Ventricular effacement
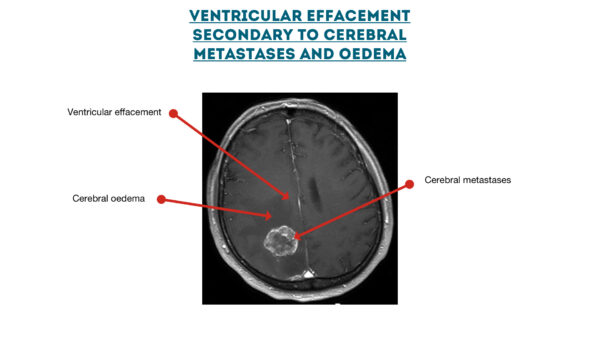
Ventricular effacement describes a thinning in the appearance of the ventricles. This may result from cerebral oedema secondary to a mass or an intracranial haemorrhage. The shift in CSF that occurs in these cases follows the Monro-Kellie doctrine.
Other intraventricular pathology
- Cysts
- Tumours
- Infective lesions
Bone
Assess the bones of the skull using the appropriate windowing.
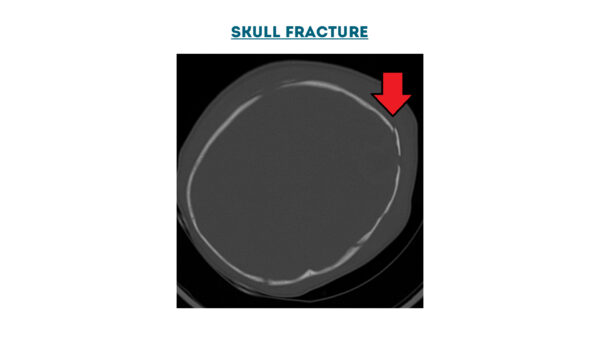
Look for fractures of the calvarium and skull base. Subtle areas of low density within the inner table of the skull may represent small locules of air in the soft tissue windows. Careful evaluation to look for subtle fractures here is essential.
Superficial soft tissue injury may be associated with underlying fractures.
References
- Birur, NPraveen; Patrick, Sanjana; Gurushanth, Keerthi; Raghavan, AShubhasini; Gurudath, Shubha (2017). “Comparison of gray values of cone-beam computed tomography with Hounsfield units of multislice computed tomography: An in vitro study”. Indian Journal of Dental Research. 28 (1): 66–70.
- Kimpe T, Tuytschaever T. Increasing the Number of Gray Shades in Medical Display Systems—How Much is Enough? Journal of Digital Imaging 2007;20(4):422-432.
- Hellerhoff. Extradural haemorrhage. Licence: [CC BY-SA 3.0].
- James Heilman, MD. Subdural haemorrhage. Licence: [CC BY-SA 3.0].
- James Heilman, MD. Subarachnoid haemorrhage. Licence: [CC BY-SA 3.0].
- James Heilman, MD. Hypoxic brain injury. Licence: [CC BY-SA 4.0].
- James Heilman, MD. Pneumocephalus. Licence: [CC BY-SA 4.0].
- CMarvin 101. Cerebral metastases. Licence: [CC BY-SA 2.0 de].
- James Heilman, MD. Hyperdense MCA. Licence: [CC BY-SA 4.0].
- Hellerhoff. Meningioma. Licence: [CC BY-SA 3.0].
- Aaron G. Filler, MD, PhD, FRCS. Choroid plexus. Licence: [CC BY-SA 3.0].
- Lucien Monfils. Hydrocephalus. Licence: [CC BY-SA 3.0].
- James Heilman, MD. Skull fracture. Licence: [CC BY-SA 4.0].


0 Comments